The Analytics feature provides you with valuable insights into how your chatbot(s) are performing. You can generate data either for a specific chatbot or for all chatbots under your account. The data is displayed for a chosen time range, which can be adjusted according to your needs. By default, analytics is shown for the last 7 days, but you can select up to the last 31 days.
Accessing Analytics
To view analytics, follow these steps:
-
Log into your dashboard and select the chatbot.
-
Navigate to the "Analytics" section in the menu.
-
Select the chatbot or choose "All Chatbots" to view combined data for all.
-
Adjust the time range if needed (up to 31 days).
General Analytics Charts
Once you access the analytics page, the following charts will be available:
-
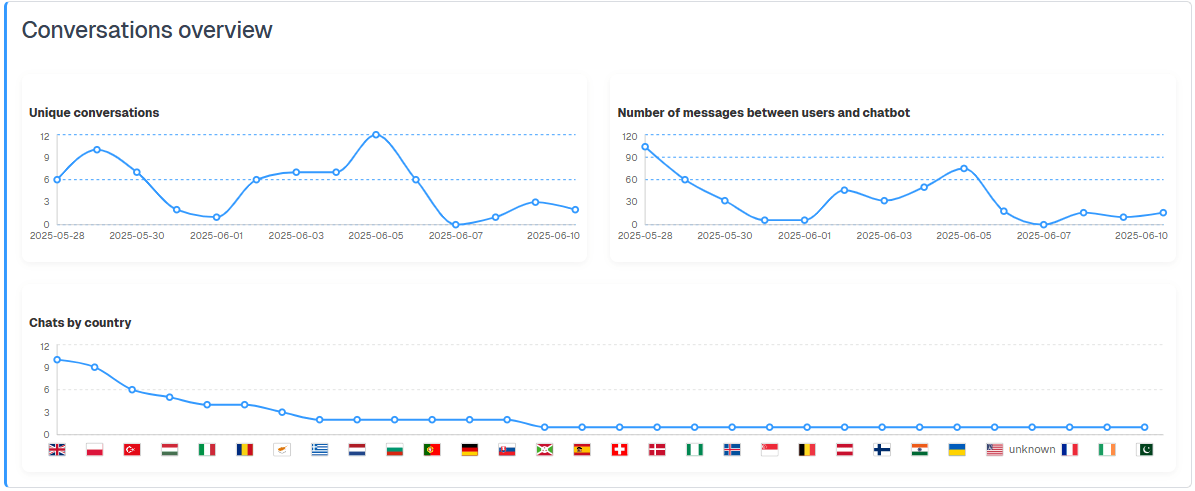
Unique Conversations Per Day: This chart shows the number of unique conversations your chatbot(s) have had with end users each day.
-
Total Messages Exchanged Per Day: Displays the total number of messages exchanged between users and your chatbot(s) on a daily basis.
-
User Interaction by Country: This map provides a visual representation of the countries where users are interacting with your chatbot(s).
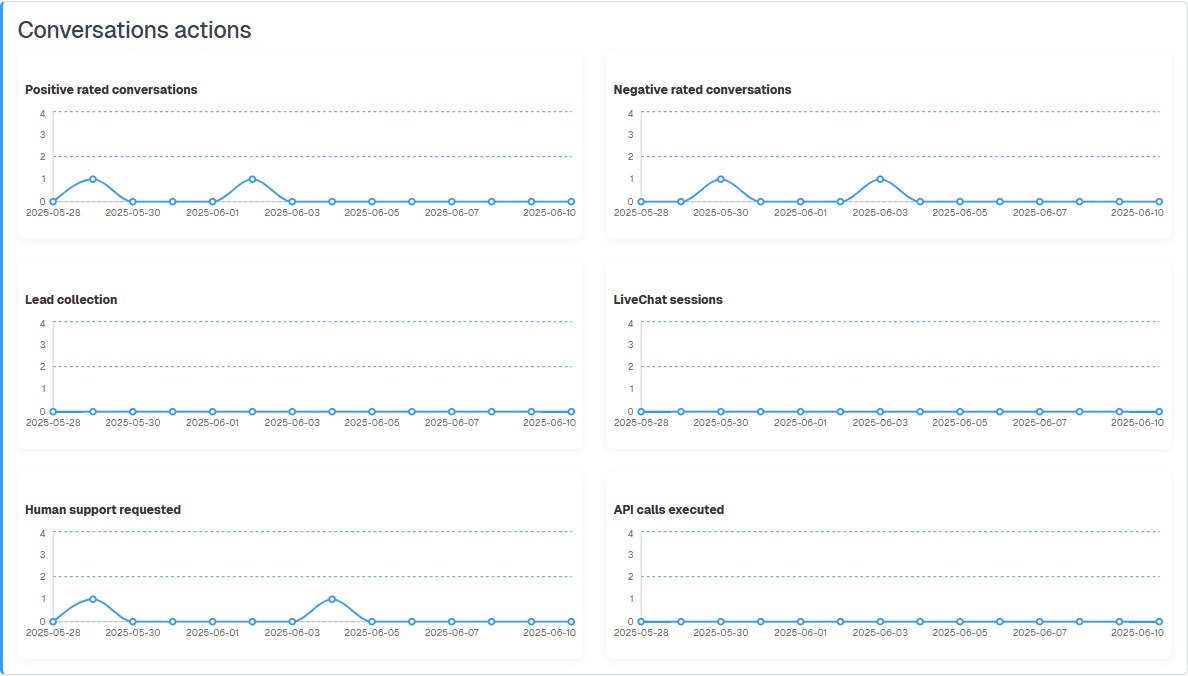
Conversation actions statistics
In the **Conversation actions **section, more specific data is provided based on your chatbot’s configuration:
-
Positive vs. Negative Ratings Per Day: Tracks the number of conversations that received a positive or negative rating from users
-
Leads Collected Per Day: If lead collection is enabled, this chart displays the number of leads collected daily
-
Live Chat Sessions: If live chat is available in your subscription and enabled, you’ll see the total number of live chat sessions initiated by users each day
-
Human Support Requests: Shows the number of times end users requested human support, if this option is enabled
-
API Calls Executed: This chart displays the number of API calls made by the chatbot when it triggers specific functions, if API integration is enabled